GrowthForecast
GrowthForecast is a web tool that let's you graph all sorts of metrics via a WebAPI. Our simple API let's you create and update charts in real time, customize your charts through a Web interface, and create charts that combine multiple metrics.
You can graph your MySQL data with 1 line of code
$ crontab -l
*/5 * * * * curl -F number=`mysql -BN -e 'select count(*) from member' game` http://example.com/api/socialgame/member/register 2>&1 | logger -t post_gf -p local0.info
By periodically POSTing to GrowthForecast with cron, you can make charts without having to deal with complex settings
Installing and Booting
(1) Installing Package Dependencies
We'll first install the libraries that RRDTool depends on using package managers like yum, apt, homebrew, etc.
- glib
- xml2
- pango
- cairo
CentOS
$ sudo yum groupinstall "Development Tools"
$ sudo yum install pkgconfig glib2-devel gettext libxml2-devel pango-devel cairo-devel
Ubuntu
$ sudo apt-get build-dep rrdtool
(2) Installing GrowthForecast
We'll use the cpanm command to install GrowthForecast together with its module dependencies.
We recommend that you use Perl built with perlbrew (or others) rather than the default Perl that ships with your OS.
$ cpanm -n GrowthForecast
Please check for version information on CPAN. Installation will take a bit of time since there are a many module dependencies.
(3) Starting GrowthForecast
You've now installed GrowthForecast! To start GrowthForecast, please execute "growthforecast.pl".
If you run it with the data-dir option (specifying the directory to store the graph data), the web server will start on port 5125. You can verify this in your browser.
Boot Command
$ growthforecast.pl --data-dir /home/user/growthforecast
Other Boot Options
| Option Name | Description |
|---|---|
| port | The TCP port to bind to. Default: port 5125. |
| host | The IP address to bind to. Default: 0.0.0.0 |
| front-proxy | If using reverse proxy, uses the IP address of the reverse proxy or CIDR. Multiple IP addresses can be set |
| allow-from | Specify the IP address from which the service can be accessed. If not set, the service can be accessed by all remote hosts. |
| disable-1min-metrics | Stop the service from updating the graph every minute. |
| with-mysql | Use MySQL instead of the default SQLite for the database holding the graph information. Specify using the form dbi:mysql:[dbname];hostname=[hostname]. |
| time-zone | Set the system time zone for GrowthForecast. Default is the host system timezone. |
| h (or) help | Display the help info. |
| v (or) version | Display the version info.. |
If Using MySQL
You will need the following permissions when using the --with-mysql option.
- CREATE
- ALTER
- DELETE
- INSERT
- UPDATE
- SELECT
Expamle of GRANT Command
mysql> GRANT  CREATE, ALTER, DELETE, INSERT, UPDATE, SELECT \\
         ON growthforecast.* TO 'www'\@'localhost' IDENTIFIED BY foobar;
Your username and password are set by system environment variables.
$ MYSQL_USER=www MYSQL_PASSWORD=foobar growthforecast.pl \\
      --data-dir /home/user/growthforecast \\
      --with-mysql dbi:mysql:growthforecast;hostname=localhost
Basic Usage
How to Register Graphs
To create graphs or update data, make a request to the following URL via a POST method.
http://example.com/api/:service_name/:section_name/:graph_name
The names of the items within the URL to POST to are shown in the table to the right.
You can use multi-byte strings for each item name as long as it is UTF-8.
| The Name Used in the Example | Purpose | Actual Parameters |
|---|---|---|
| :service_name | The name of the service that you'd like to graph | blog, photo, place, socialgame |
| :section_name | The name of the feature or system to graph, within said service. | entry, user, spot, items |
| :graph_name | The actual name of the value being graphed | total_entry, kakin_user, muryo_user |
For example, if we are graphing the number of registered users in a social game, we would POST to the following URL:
http://example.com/api/socialgame/member/register
Also, we would use the following parametens when POSTing.
| Parameter | Description | Required/Optional |
|---|---|---|
| number | The number to give the graph | Required |
| mode | Update method for the number: count, modified, gauge。 count: Add the value of the number parameter to the pre-registered value. modified: Overwrite if the value differs from last time. gauge: Always overwrite with the value of number Default: gauge mode |
Optional |
| color | The color of the grah. Specify with #FFFFFF format. | Optional (auto-generated if unspecified in a new graph) |
| timestamp | The time of the plot. Specify in integer (epoch time) which is larger than 315360010.
This would be useful when you want to explicitly specify the timestamp written in logs, for example. LIMITATION1: only accepts the timestamp which is newer than the last update time (limitation of rrdtool). LIMITATION2: GrowthForecast worker runs rrdupdate in each interval (1 min for short worker, 5 mins for long worker). Only the latest data in each interval is used. |
Optional (current time is used if unspecified) |
| datetime | The times of the plot in string format. "Wed, 09 Feb 1994 22:23:32 GMT" -- HTTP format "Thu Feb 3 17:03:55 GMT 1994" -- ctime(3) format "Thu Feb 3 00:00:00 1994", -- ANSI C asctime() format "Tuesday, 08-Feb-94 14:15:29 GMT" -- old rfc850 HTTP format "Tuesday, 08-Feb-1994 14:15:29 GMT" -- broken rfc850 HTTP format "03/Feb/1994:17:03:55 -0700" -- common logfile format "09 Feb 1994 22:23:32 GMT" -- HTTP format (no weekday) "08-Feb-94 14:15:29 GMT" -- rfc850 format (no weekday) "08-Feb-1994 14:15:29 GMT" -- broken rfc850 format (no weekday) "1994-02-03 14:15:29 -0100" -- ISO 8601 format "1994-02-03 14:15:29" -- zone is optional "1994-02-03" -- only date "1994-02-03T14:15:29" -- Use T as separator "19940203T141529Z" -- ISO 8601 compact format "19940203" -- only date |
Optional (current time is used if unspecified, timestamp parameter is used if both timestamp and datetime are specified) |
Example: Creating a New Graph
The example below shows how to create a new graph or update an existing one, using Perl's LWP module.
my $ua = LWP::UserAgent->new;
$ua->post('http://example.com/api/socialgame/member/register',{
    number      => 10,
    color       => '#333399'
});
If using curl:
$ curl -F number=10 http://example.com/api/socialgame/member/register
Internal
Mechanism of GrowthForeacst
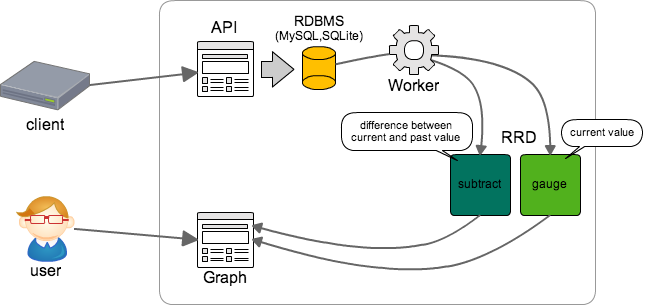
GrowthForecast uses RRDtool as a tool for graph drawing and Round Robbin Database.
Data sent to the endpoint of the API is stored temporarily into RDBMS. Worker reads the data from the RDBMS, and update RRD files periodically. In doing so, GrowthForecast worker stores the difference from the previous value as a `subtract` data in addition to the current value.
By utilizing the `subtract` data as a source of the graph, GrowthForecast makes possible to visualize the change of the data.
Other API
Adding a vertical line (GrowthForecast 0.82 or later)
You can draw vertical line(s) on graph(s)
Endpoint
Adding vertical line(s) http://example.com/vrule/api[/:service_name[/:section_name[/:graph_name]]]
Getting a vertical line data http://example.com/vrule/summary[/:service_name[/:section_name[/:graph_name]]]
Parameters on Adding Vertical Line(s)
| Parameter | Description | Required/Optional |
|---|---|---|
| time | Date time to draw a vertical line. Uses the format "2011/12/08 12:10:00". Default: the current time | Optional |
| color | The color of the vertical line. Uses the format #FFFFFF. Default: #FF0000 | Optional |
| description | The description of the vertical line | Optional |
Example of adding a vertical line
If using curl:
$ curl -F description=deploy -F color=#FF0000 http://example.com/vrule/api/socialgame/member
Parameters on Getting a Vertical Line Data
| Parameter | Description |
|---|---|
| t | The time range to get data. all(all period)、c(custom, use `to` and `from`)、h(1 hour)、n(half a day)、w(1 week)、m(1 month) y(1 year) 3d(3 days) 8h(8 hours) 4h(4 hours) |
| from | When `t` is set to `c`, the start time to get. Uses the format "2011/12/08 12:10:00" |
| to | When `t` is set to `c`, the end time to get. Uses the format "2011/12/08 12:10:00" |
Customizing the Graph's Appearance
You can customize the graph's appearance by adding a few parameters to the graph's URI.
Endpoint
URI of a Graph     http://example.com/graph/:service_name/:section_name/:graph_name
URI of a Compound Graph http://example.com/graph/:pattern
List of Supported Parameters
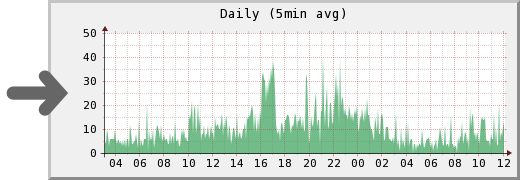
You can even make graphs like the one below just by changing the parameters!
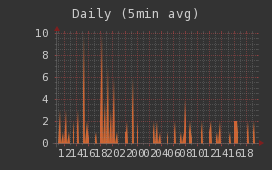
http://example.com/graph/service/section/graph?t=d&gmode=gauge&border=0&legend=0&width=200&background_color=333333&canvas_color=333333&font_color=CCCCCC&axis_color=666666
| Parameter | Description |
|---|---|
| t | The range of the graph: y(1 year), m(1 month), w(1 week), 3d(3 days), s3d(3 days, refresh every minute), d(1 day), sd(1 day, refresh every minute), 8h(8 hours), s8h(8 hours, refresh every minute), 4h(4 hours), s4h(4 hours, refresh every minute), h(1 hour), sh(1 hour, refresh every minute), n(half a day), sn(half a day, refresh every minute), c(custom)、sc(custom, refresh every minute) |
| from | When `t` is set to `c` or `sc`, this value sets the start time of the graph. Uses the format: 2011/12/08 12:10:00 |
| to | When `t` is set to `c` or `sc`, this value sets the end time of the graph. Uses the format: 2011/12/08 12:10:00 |
| gmode | Chooses the type of graph: plots "the actual values as is" on a (gauge) graph or a "difference between current and past value" (subtract) graph. Default: gauge |
| width | The width of the graph. (The actual width is a bit wider due to the Legend and other elements) |
| height | The height of the graph. (The actual height is a bit higher due to the Legend and other elements) |
| graphonly | This mode only plots the graph. No other elements are plotted. Default: 0 |
| logarithmic | Graphs in logarithmic scale. Default: 0 |
| xgrid | Setup for the X-axis. Details regarding the format can be found in the rrdtool documentation. |
| ygrid | Setup for the Y-axis. Details regarding the format can be found in the rrdtool documentation. |
| background_color | Background color. Specify using the FFFFFF or FFFFFF00 formats (last 2 characters are for the alpha channel). |
| canvas_color | The canvas (background) color of the graph. Specify using the FFFFFF or FFFFFF00 formats. |
| font_color | The font color. Specify using the FFFFFF or FFFFFF00 formats. |
| frame_color | The frame color of the Legend. Specify using the FFFFFF or FFFFFF00 formats. |
| axis_color | The border color of the graph. Specify using the FFFFFF or FFFFFF00 formats. |
| shadea_color | The border colors for top left and top. Specify using the FFFFFF or FFFFFF00 formats. |
| shadeb_color | The border colors for bottom right and bottom. Specify using the FFFFFF or FFFFFF00 formats. |
| border | The thickness of the borders. `0` is a valid value. Default: 3. |
| legend | Enable the Legend (including summary data of the graph). Default: 1 |
| sumup | Include the sum value in the Legend. Default: 0 |
Graph Data Summary
You can export the Legend information (which includes the summary data of the graph) in JSON format.
Endpoint
URI of the Graph Summary    http://example.com/summary/:service_name/:section_name/:graph_name
URI of the Compound Graph Summary  http://example.com/summary/:pattern
Exporting Graph Data
You can export your graph data in JSON format.
Endpoint
URI of the Graph http://example.com/xport/:service_name/:section_name/:graph_name
URI of the Compound Graph http://example.com/xport/:pattern
List of Parameters
| Parameter | Description |
|---|---|
| t | The range of the graph: y(1 year), m(1 month), w(1 week), 3d(3 days), s3d(3 days, refresh every minute), d(1 day), sd(1 day, refresh every minute), 8h(8 hours), s8h(8 hours, refresh every minute), 4h(4 hours), s4h(4 hours, refresh every minute), h(1 hour), sh(1 hour, refresh every minute), n(half a day), sn(half a day, refresh every minute), c(custom)、sc(custom, refresh every minute) |
| from | When `t` is set to `c` or `sc`, this value sets the start time of the graph. Uses the format: 2011/12/08 12:10:00 |
| to | When `t` is set to `c` or `sc`, this value sets the end time of the graph. Uses the format: 2011/12/08 12:10:00 |
| gmode | Chooses the type of graph: plots "the actual values as is" on a (gauge) graph or a "difference between current and past value" (subtract) graph. Default: gauge |
| width | Maximum number of rows. |
Related Softwares
fluent-plugin-growthforecast
https://github.com/tagomoris/fluent-plugin-growthforecast
Fluentd plugin to output numbers(metrics) to 'GrowthForecast', metrics drawing tool over HTTP.
rb-growthforecast (ruby)
https://github.com/tagomoris/rb-growthforecast
Client library and command to operate GrowthForecast
growthforecast-client (ruby)
https://github.com/sonots/growthforecast-client
growthforecast-client is a ruby client library for GrowthForecast API where GrowthForecast is a visualization graph tool.
Net::GrowthForecast (perl)
https://metacpan.org/pod/Net::GrowthForecast
A client library for awesome visualization tool GrowthForecast